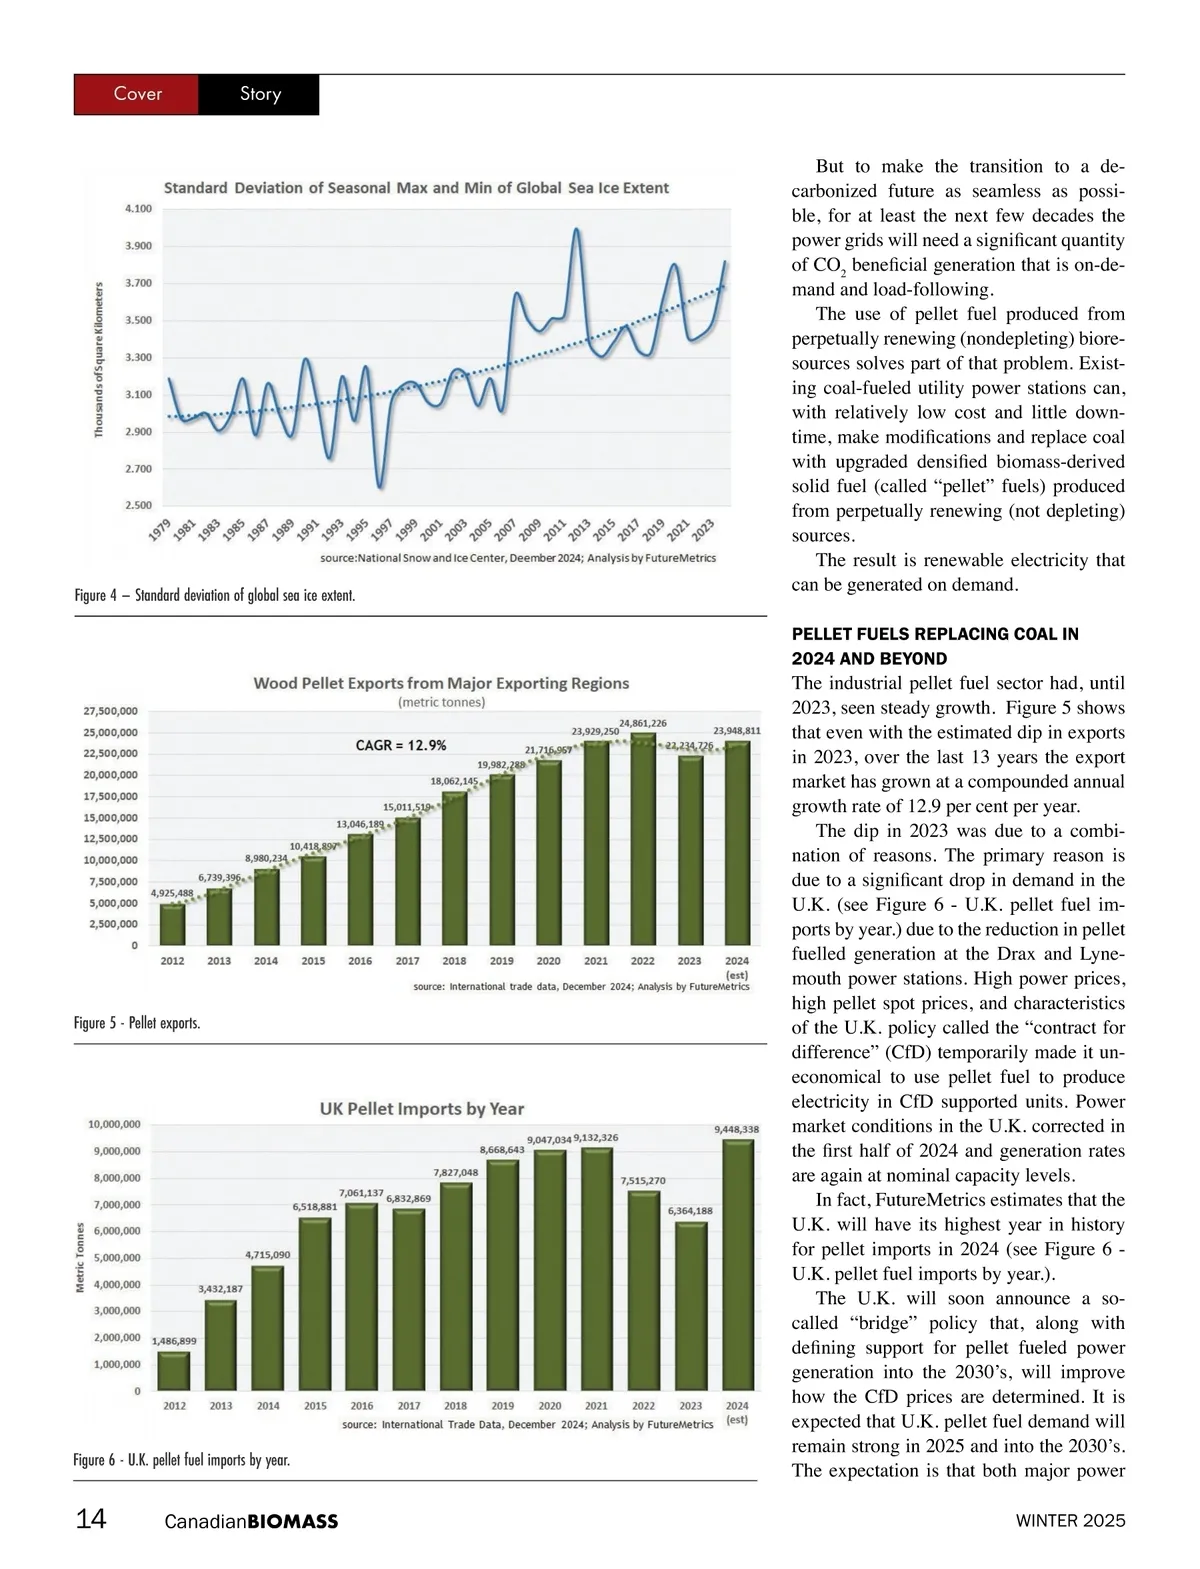
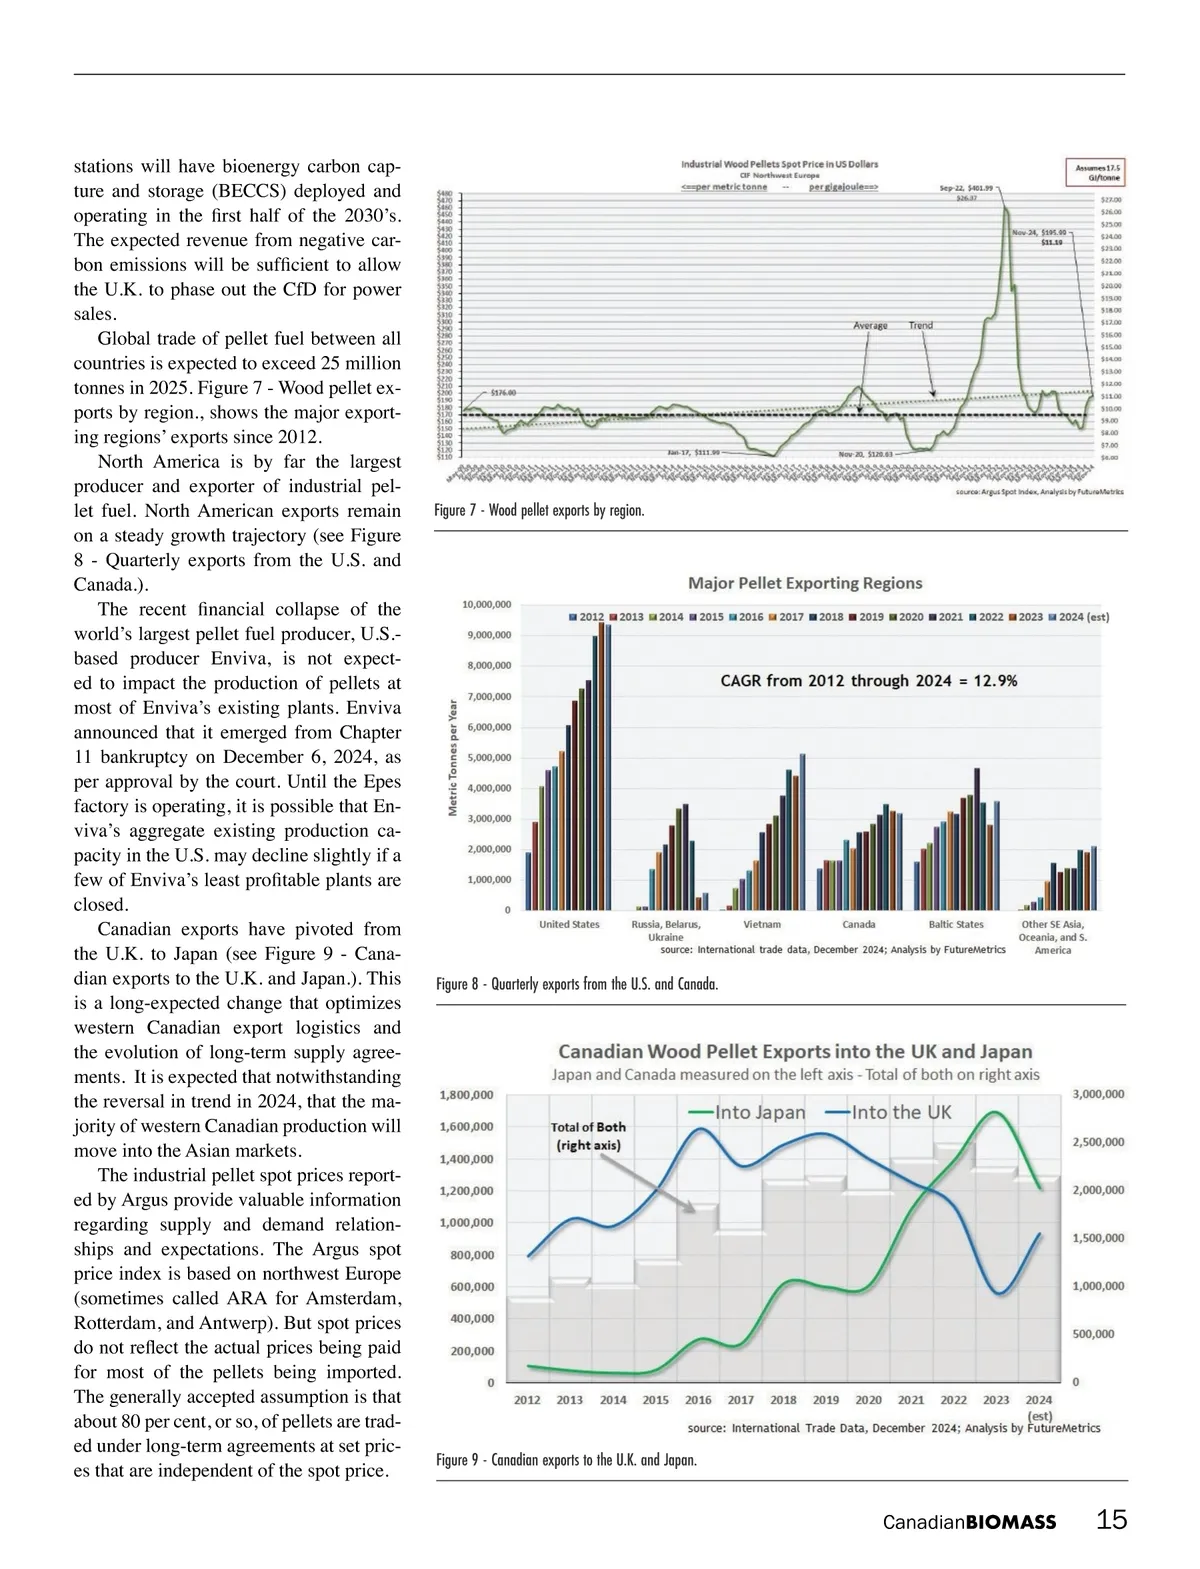
stations will have bioenergy carbon cap -ture and storage (BECCS) deployed and operating in the first half of the 2030’s. The expected revenue from negative car -bon emissions will be sufficient to allow the U.K. to phase out the CfD for power sales. Global trade of pellet fuel between all countries is expected to exceed 25 million tonnes in 2025. Figure 7 -Wood pellet ex -ports by region., shows the major export -ing regions’ exports since 2012. North America is by far the largest producer and exporter of industrial pel -let fuel. North American exports remain on a steady growth trajectory (see Figure 8 -Quarterly exports from the U.S. and Canada.). The recent financial collapse of the world’s largest pellet fuel producer, U.S.-based producer Enviva, is not expect -ed to impact the production of pellets at most of Enviva’s existing plants. Enviva announced that it emerged from Chapter 11 bankruptcy on December 6, 2024, as per approval by the court. Until the Epes factory is operating, it is possible that En -viva’s aggregate existing production ca -pacity in the U.S. may decline slightly if a few of Enviva’s least profitable plants are closed. Canadian exports have pivoted from the U.K. to Japan (see Figure 9 -Cana -dian exports to the U.K. and Japan.). This is a long-expected change that optimizes western Canadian export logistics and the evolution of long-term supply agree -ments. It is expected that notwithstanding the reversal in trend in 2024, that the ma -jority of western Canadian production will move into the Asian markets. The industrial pellet spot prices report -ed by Argus provide valuable information regarding supply and demand relation -ships and expectations. The Argus spot price index is based on northwest Europe (sometimes called ARA for Amsterdam, Rotterdam, and Antwerp). But spot prices do not reflect the actual prices being paid for most of the pellets being imported. The generally accepted assumption is that about 80 per cent, or so, of pellets are trad -ed under long-term agreements at set pric -es that are independent of the spot price. Figure 7 -Wood pellet exports by region. Figure 8 -Quarterly exports from the U.S. and Canada. Figure 9 -Canadian exports to the U.K. and Japan. Canadian BIOMASS 15
Canadian Biomass Winter 2025: Page 15