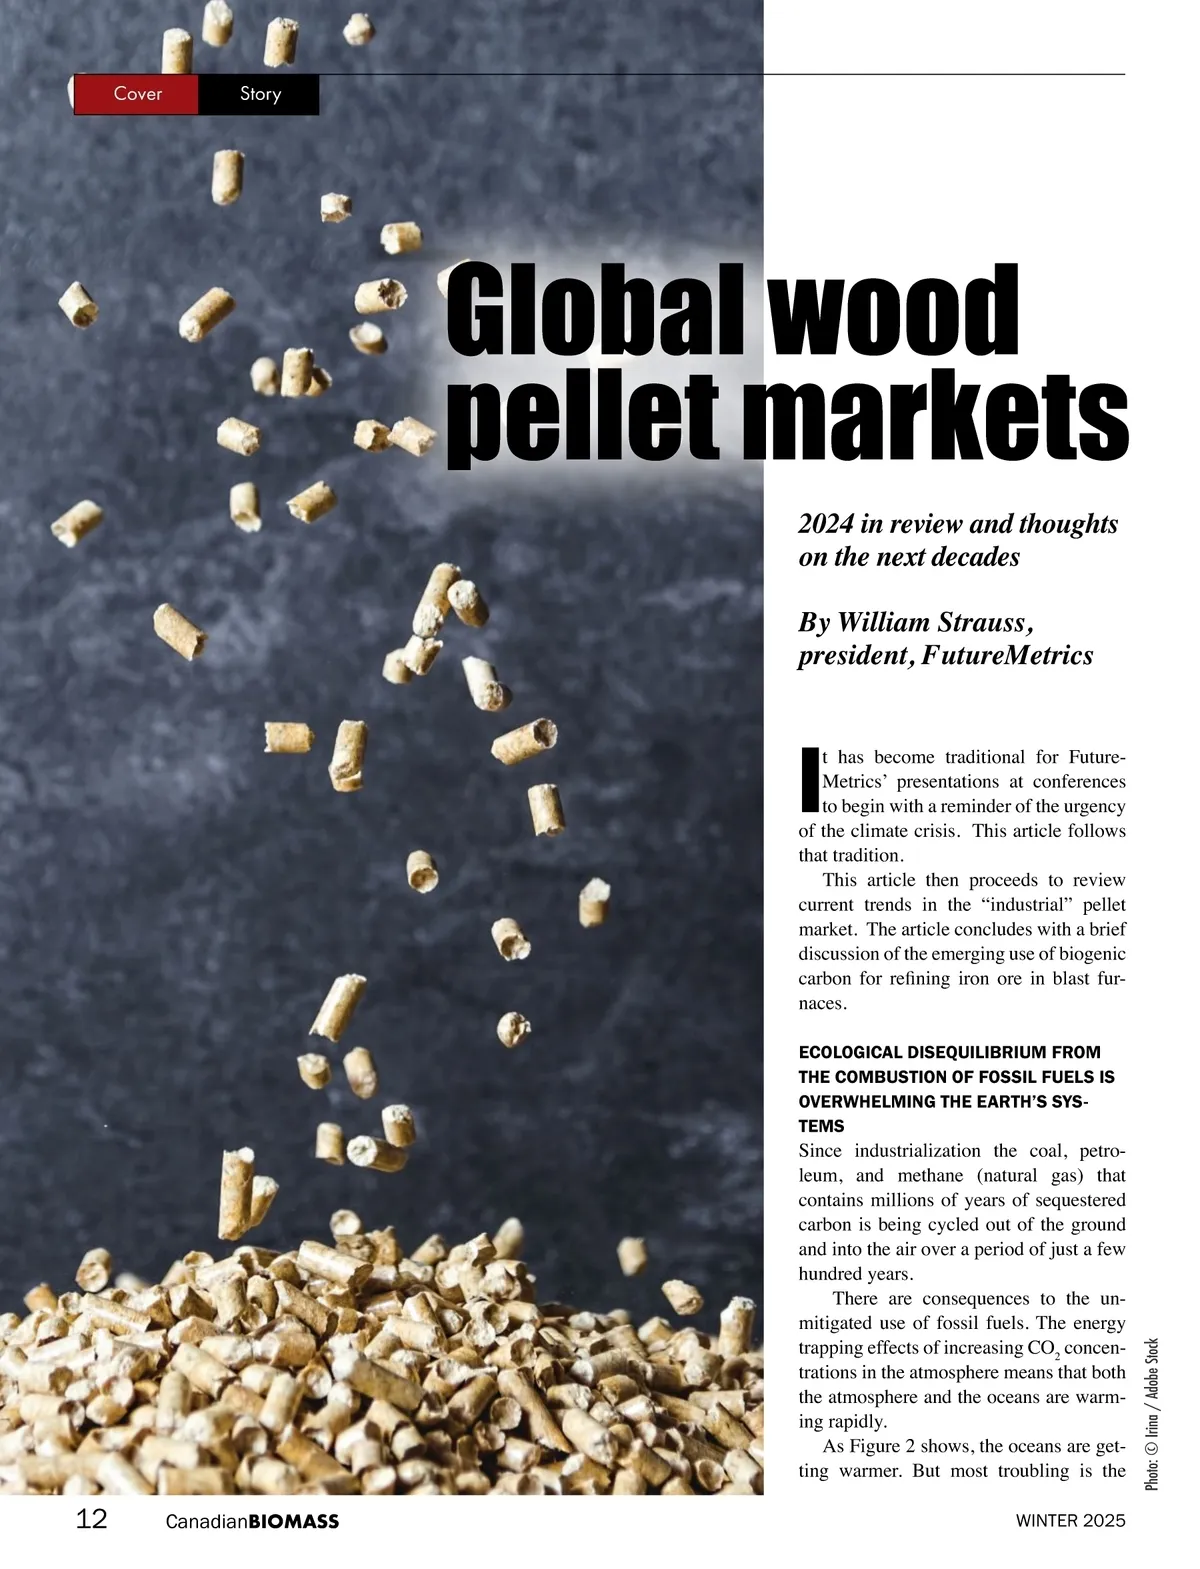
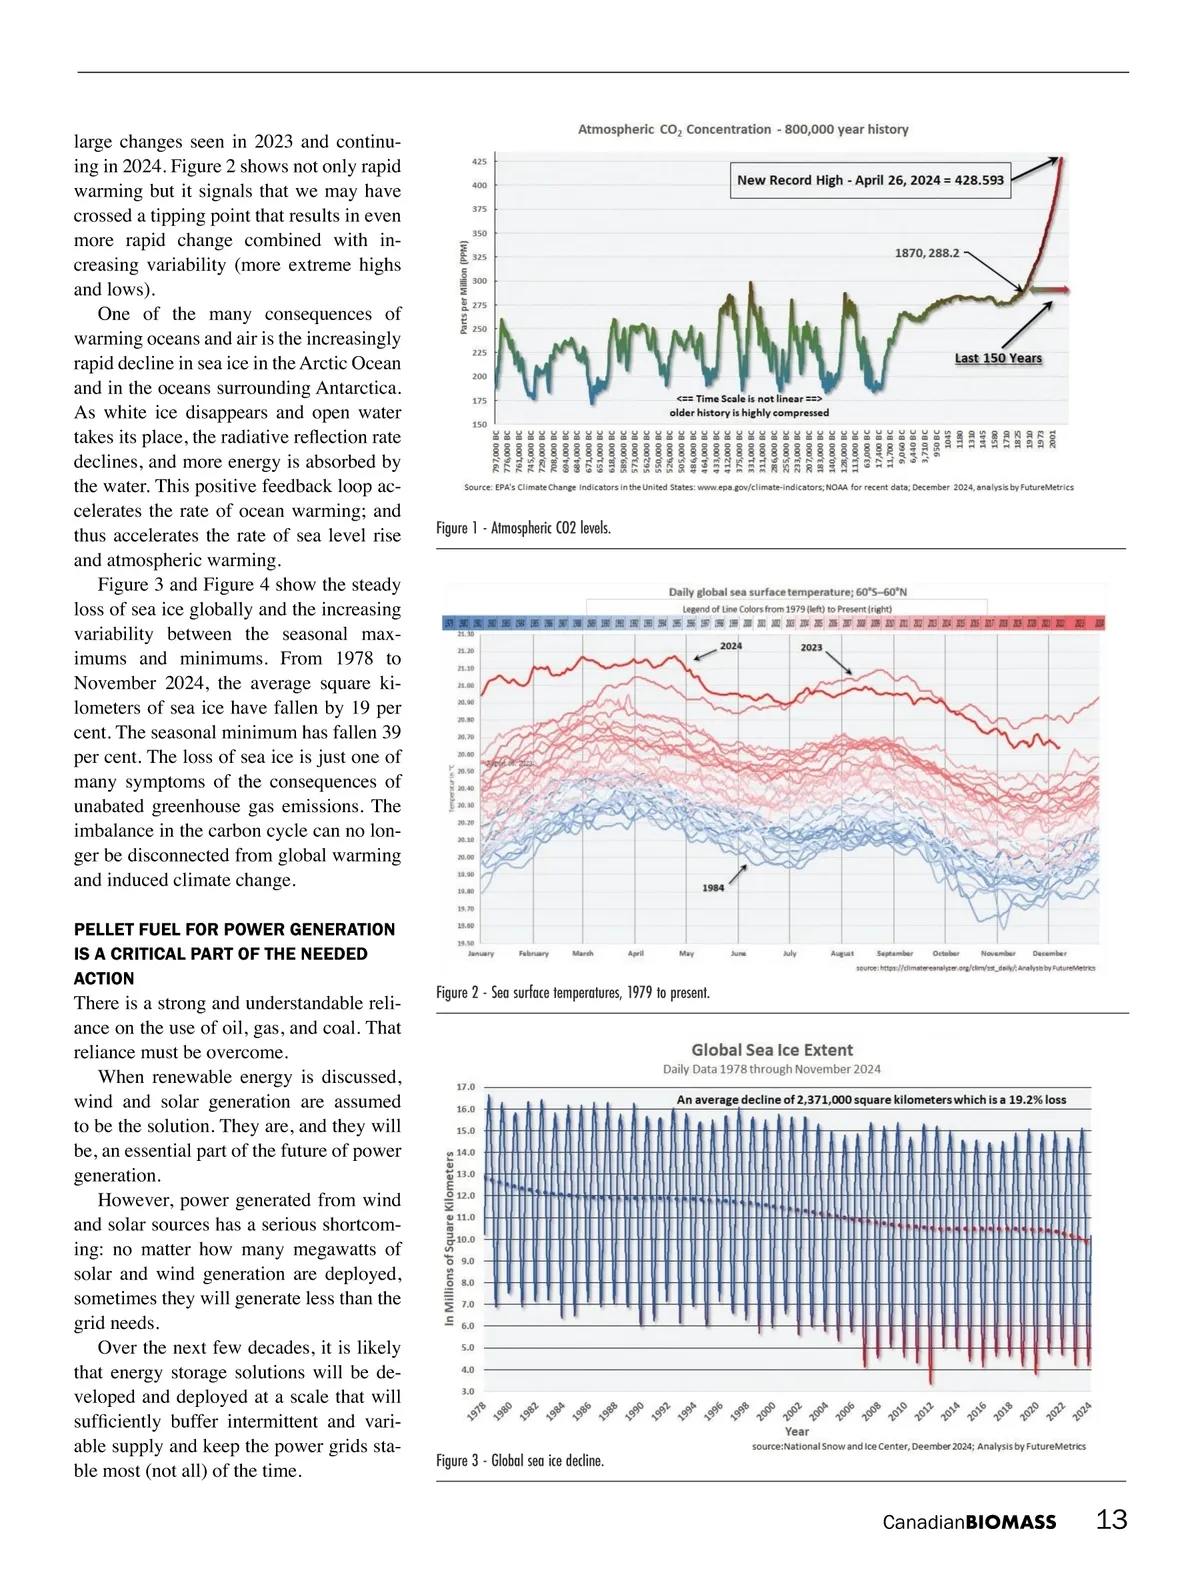
large changes seen in 2023 and continu -ing in 2024. Figure 2 shows not only rapid warming but it signals that we may have crossed a tipping point that results in even more rapid change combined with in -creasing variability (more extreme highs and lows). One of the many consequences of warming oceans and air is the increasingly rapid decline in sea ice in the Arctic Ocean and in the oceans surrounding Antarctica. As white ice disappears and open water takes its place, the radiative reflection rate declines, and more energy is absorbed by the water. This positive feedback loop ac -celerates the rate of ocean warming; and thus accelerates the rate of sea level rise and atmospheric warming. Figure 3 and Figure 4 show the steady loss of sea ice globally and the increasing variability between the seasonal max -imums and minimums. From 1978 to November 2024, the average square ki -lometers of sea ice have fallen by 19 per cent. The seasonal minimum has fallen 39 per cent. The loss of sea ice is just one of many symptoms of the consequences of unabated greenhouse gas emissions. The imbalance in the carbon cycle can no lon -ger be disconnected from global warming and induced climate change. PELLET FUEL FOR POWER GENERATION IS A CRITICAL PART OF THE NEEDED ACTION Figure 1 -Atmospheric CO2 levels. There is a strong and understandable reli -ance on the use of oil, gas, and coal. That reliance must be overcome. When renewable energy is discussed, wind and solar generation are assumed to be the solution. They are, and they will be, an essential part of the future of power generation. However, power generated from wind and solar sources has a serious shortcom -ing: no matter how many megawatts of solar and wind generation are deployed, sometimes they will generate less than the grid needs. Over the next few decades, it is likely that energy storage solutions will be de -veloped and deployed at a scale that will sufficiently buffer intermittent and vari -able supply and keep the power grids sta -ble most (not all) of the time. Figure 2 -Sea surface temperatures, 1979 to present. Figure 3 -Global sea ice decline. Canadian BIOMASS 13
Canadian Biomass Winter 2025: Page 13