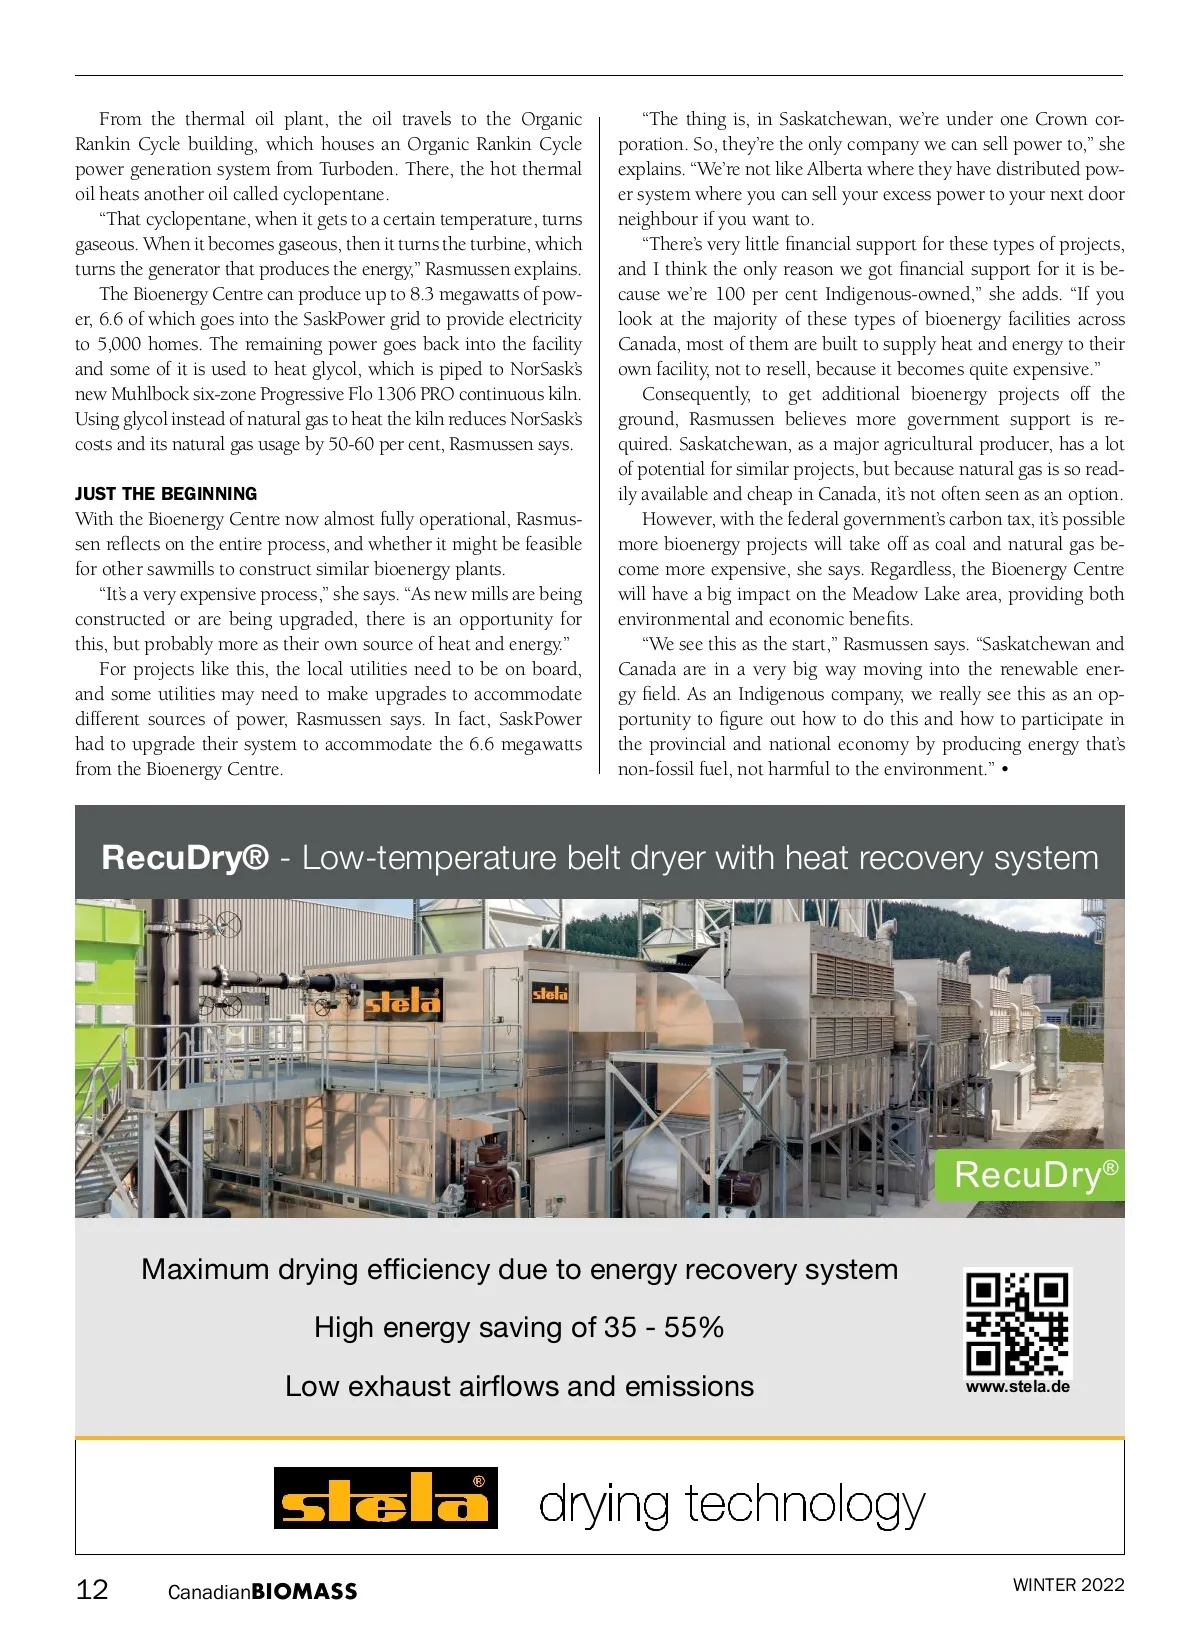
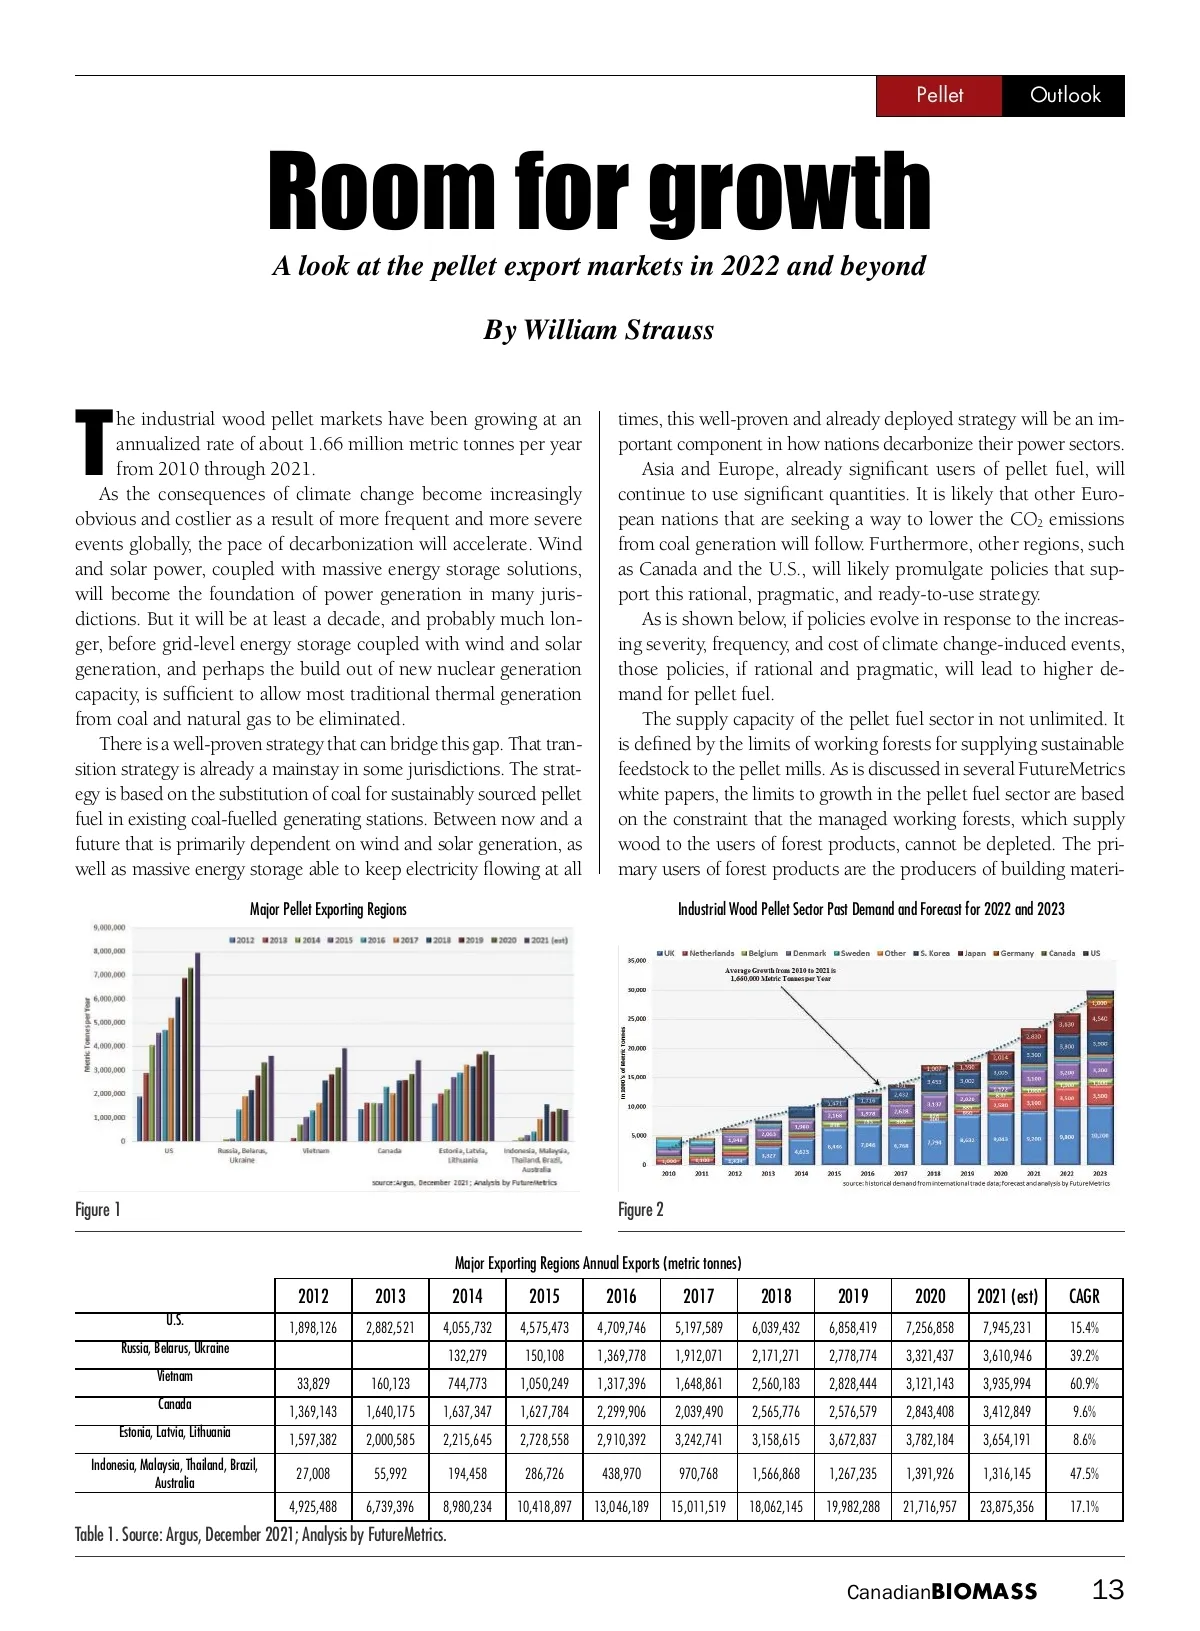
Pellet Outlook Room for growth A look at the pellet export markets in 2022 and beyond By William Strauss he industrial wood pellet markets have been growing at an annualized rate of about 1.66 million metric tonnes per year from 2010 through 2021. As the consequences of climate change become increasingly obvious and costlier as a result of more frequent and more severe events globally, the pace of decarbonization will accelerate. Wind and solar power, coupled with massive energy storage solutions, will become the foundation of power generation in many juris-dictions. But it will be at least a decade, and probably much lon-ger, before grid-level energy storage coupled with wind and solar generation, and perhaps the build out of new nuclear generation capacity, is sufficient to allow most traditional thermal generation from coal and natural gas to be eliminated. There is a well-proven strategy that can bridge this gap. That tran-sition strategy is already a mainstay in some jurisdictions. The strat-egy is based on the substitution of coal for sustainably sourced pellet fuel in existing coal-fuelled generating stations. Between now and a future that is primarily dependent on wind and solar generation, as well as massive energy storage able to keep electricity flowing at all Major Pellet Exporting Regions T times, this well-proven and already deployed strategy will be an im-portant component in how nations decarbonize their power sectors. Asia and Europe, already significant users of pellet fuel, will continue to use significant quantities. It is likely that other Euro-pean nations that are seeking a way to lower the CO 2 emissions from coal generation will follow. Furthermore, other regions, such as Canada and the U.S., will likely promulgate policies that sup-port this rational, pragmatic, and ready-to-use strategy. As is shown below, if policies evolve in response to the increas-ing severity, frequency, and cost of climate change-induced events, those policies, if rational and pragmatic, will lead to higher de-mand for pellet fuel. The supply capacity of the pellet fuel sector in not unlimited. It is defined by the limits of working forests for supplying sustainable feedstock to the pellet mills. As is discussed in several FutureMetrics white papers, the limits to growth in the pellet fuel sector are based on the constraint that the managed working forests, which supply wood to the users of forest products, cannot be depleted. The pri-mary users of forest products are the producers of building materi-Industrial Wood Pellet Sector Past Demand and Forecast for 2022 and 2023 Figure 1 Figure 2 Major Exporting Regions Annual Exports (metric tonnes) 2012 U.S. Russia, Belarus, Ukraine Vietnam Canada Estonia, Latvia, Lithuania Indonesia, Malaysia, Thailand, Brazil, Australia 33,829 1,369,143 1,597,382 27,008 4,925,488 1,898,126 2013 2,882,521 2014 4,055,732 132,279 2015 4,575,473 150,108 1,050,249 1,627,784 2,728,558 286,726 10,418,897 2016 4,709,746 1,369,778 1,317,396 2,299,906 2,910,392 438,970 13,046,189 2017 5,197,589 1,912,071 1,648,861 2,039,490 3,242,741 970,768 15,011,519 2018 6,039,432 2,171,271 2,560,183 2,565,776 3,158,615 1,566,868 18,062,145 2019 6,858,419 2,778,774 2,828,444 2,576,579 3,672,837 1,267,235 19,982,288 2020 7,256,858 3,321,437 3,121,143 2,843,408 3,782,184 1,391,926 21,716,957 2021 (est) 7,945,231 3,610,946 3,935,994 3,412,849 3,654,191 1,316,145 23,875,356 CAGR 15.4% 39.2% 60.9% 9.6% 8.6% 47.5% 17.1% 160,123 1,640,175 2,000,585 55,992 6,739,396 744,773 1,637,347 2,215,645 194,458 8,980,234 Table 1. Source: Argus, December 2021; Analysis by FutureMetrics. Canadian BIOMASS 13
Canadian Biomass Winter 2022: Page 13