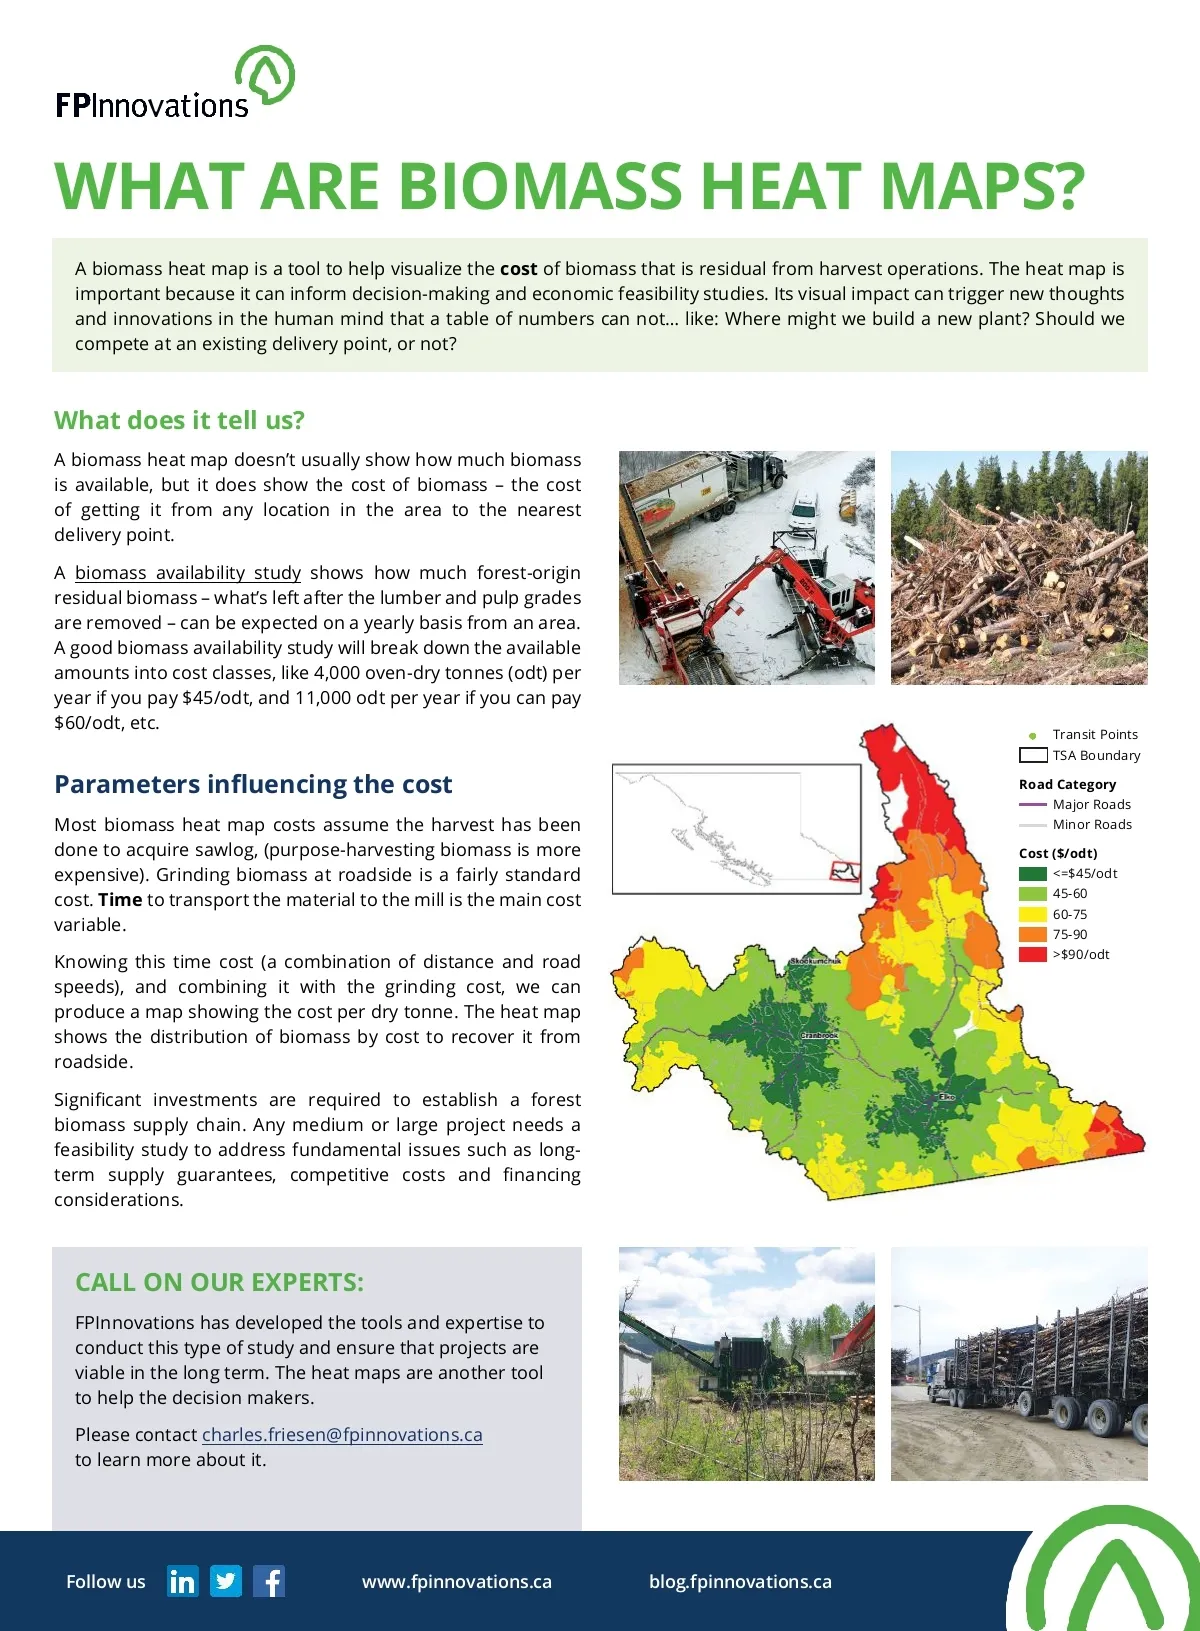
WHAT ARE BIOMASS HEAT MAPS? A biomass heat map is a tool to help visualize the cost of biomass that is residual from harvest operations. The heat map is important because it can inform decision-making and economic feasibility studies. Its visual impact can trigger new thoughts and innovations in the human mind that a table of numbers can not… like: Where might we build a new plant? Should we compete at an existing delivery point, or not? What does it tell us? A biomass heat map doesn’t usually show how much biomass is available, but it does show the cost of biomass – the cost of getting it from any location in the area to the nearest delivery point. A biomass availability study shows how much forest-origin residual biomass – what’s left after the lumber and pulp grades are removed – can be expected on a yearly basis from an area. A good biomass availability study will break down the available amounts into cost classes, like 4,000 oven-dry tonnes (odt) per year if you pay $45/odt, and 11,000 odt per year if you can pay $60/odt, etc. Transit Points TSA Boundary Road Category Major Roads Minor Roads Cost ($/odt) <=$45/odt 45-60 60-75 75-90 >$90/odt Parameters influencing the cost Most biomass heat map costs assume the harvest has been done to acquire sawlog, (purpose-harvesting biomass is more expensive). Grinding biomass at roadside is a fairly standard cost. Time to transport the material to the mill is the main cost variable. Knowing this time cost (a combination of distance and road speeds), and combining it with the grinding cost, we can produce a map showing the cost per dry tonne. The heat map shows the distribution of biomass by cost to recover it from roadside. Significant investments are required to establish a forest biomass supply chain. Any medium or large project needs a feasibility study to address fundamental issues such as long-term supply guarantees, competitive costs and financing considerations. CALL ON OUR EXPERTS: FPInnovations has developed the tools and expertise to conduct this type of study and ensure that projects are viable in the long term. The heat maps are another tool to help the decision makers. Please contact [email protected] to learn more about it. Follow us www.fpinnovations.ca blog.fpinnovations.ca
Canadian Biomass Winter 2021: Page 11