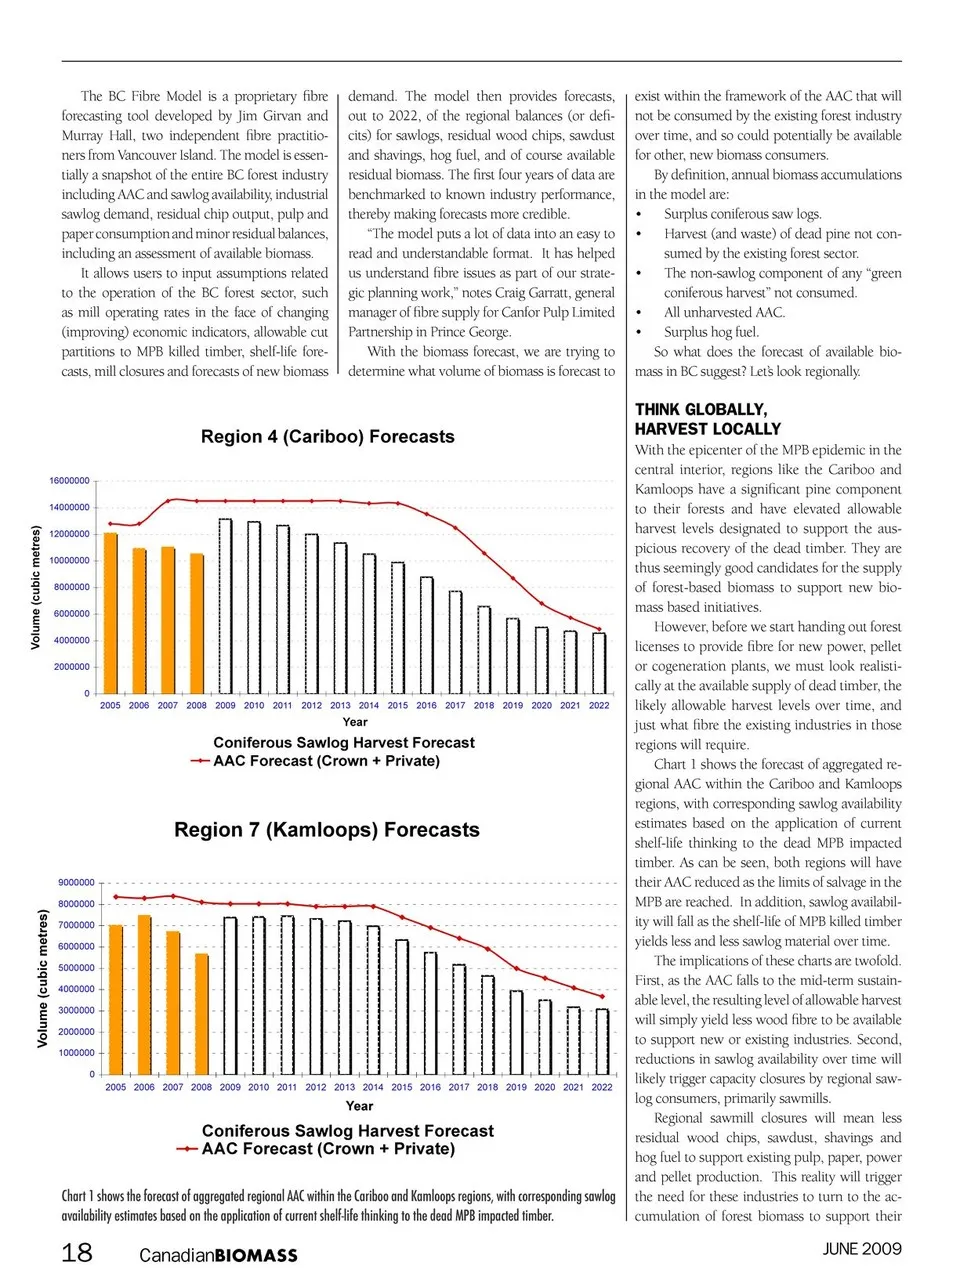
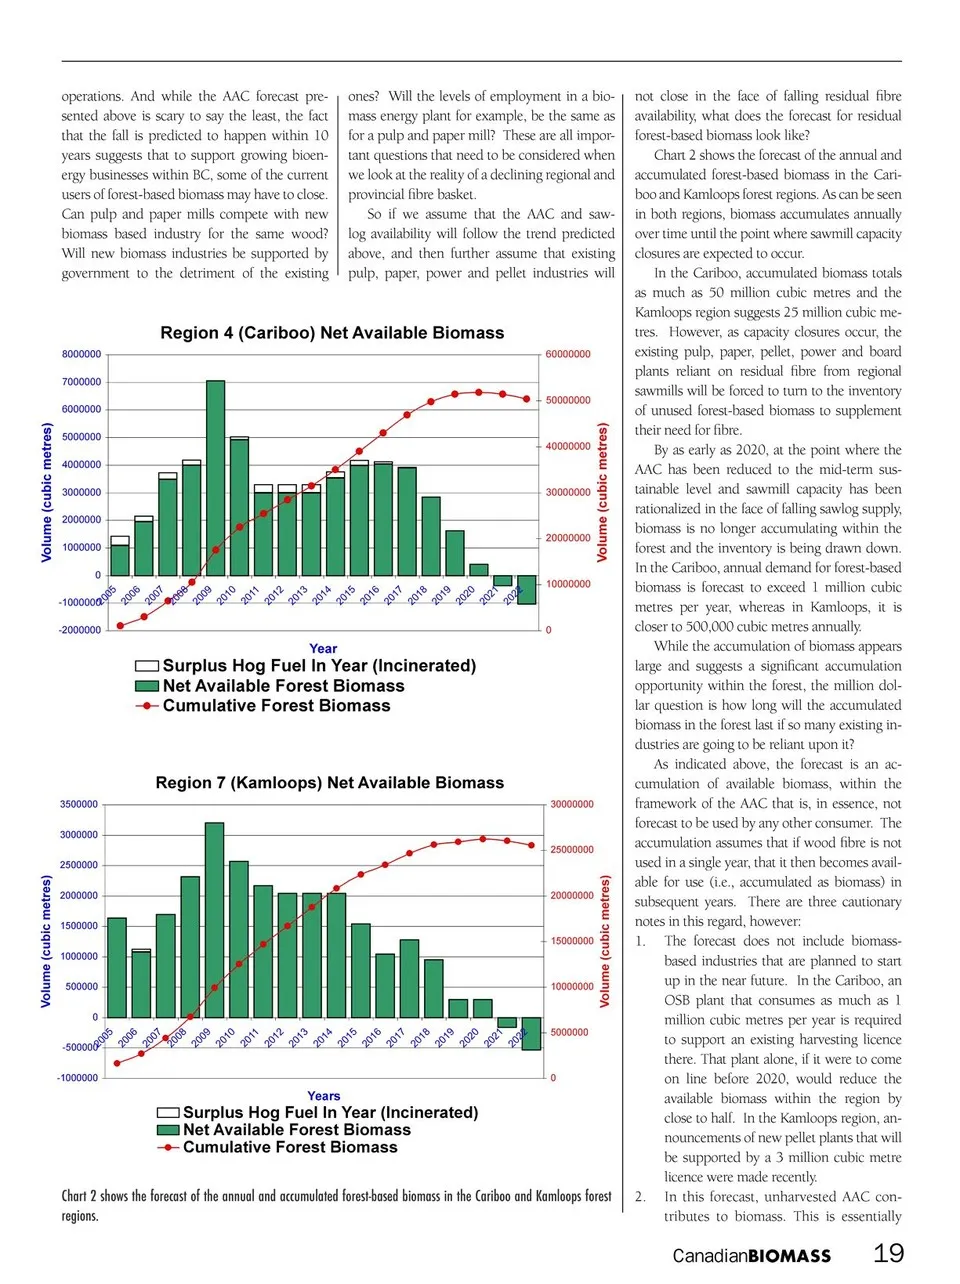
operations. And while the AAC forecast pre- sented above is scary to say the least, the fact that the fall is predicted to happen within 10 years suggests that to support growing bioen- ergy businesses within BC, some of the current users of forest-based biomass may have to close. Can pulp and paper mills compete with new biomass based industry for the same wood? Will new biomass industries be supported by government to the detriment of the existing ones? Will the levels of employment in a bio- mass energy plant for example, be the same as for a pulp and paper mill? These are all impor- tant questions that need to be considered when we look at the reality of a declining regional and provincial fibre basket. So if we assume that the AAC and saw- log availability will follow the trend predicted above, and then further assume that existing pulp, paper, power and pellet industries will Region 4 (Cariboo) Net Available Biomass 1000000 2000000 3000000 4000000 5000000 6000000 7000000 8000000 -2000000 -1000000 0 Year Surplus Hog Fuel In Year (Incinerated) Net Available Forest Biomass Cumulative Forest Biomass Region 7 (Kamloops) Net Available Biomass 1000000 1500000 2000000 2500000 3000000 3500000 500000 -1000000 -500000 0 Years Surplus Hog Fuel In Year (Incinerated) Net Available Forest Biomass Cumulative Forest Biomass Chart 2 shows the forecast of the annual and accumulated forest-based biomass in the Cariboo and Kamloops forest regions. 30000000 25000000 20000000 15000000 10000000 5000000 0 60000000 50000000 40000000 30000000 20000000 10000000 0 not close in the face of falling residual fibre availability, what does the forecast for residual forest-based biomass look like? Chart 2 shows the forecast of the annual and accumulated forest-based biomass in the Cari- boo and Kamloops forest regions. As can be seen in both regions, biomass accumulates annually over time until the point where sawmill capacity closures are expected to occur. In the Cariboo, accumulated biomass totals as much as 50 million cubic metres and the Kamloops region suggests 25 million cubic me- tres. However, as capacity closures occur, the existing pulp, paper, pellet, power and board plants reliant on residual fibre from regional sawmills will be forced to turn to the inventory of unused forest-based biomass to supplement their need for fibre. By as early as 2020, at the point where the AAC has been reduced to the mid-term sus- tainable level and sawmill capacity has been rationalized in the face of falling sawlog supply, biomass is no longer accumulating within the forest and the inventory is being drawn down. In the Cariboo, annual demand for forest-based biomass is forecast to exceed 1 million cubic metres per year, whereas in Kamloops, it is closer to 500,000 cubic metres annually. While the accumulation of biomass appears large and suggests a significant accumulation opportunity within the forest, the million dol- lar question is how long will the accumulated biomass in the forest last if so many existing in- dustries are going to be reliant upon it? As indicated above, the forecast is an ac- cumulation of available biomass, within the framework of the AAC that is, in essence, not forecast to be used by any other consumer. The accumulation assumes that if wood fibre is not used in a single year, that it then becomes avail- able for use (i.e., accumulated as biomass) in subsequent years. There are three cautionary notes in this regard, however: 1. The forecast does not include biomass- based industries that are planned to start up in the near future. In the Cariboo, an OSB plant that consumes as much as 1 million cubic metres per year is required to support an existing harvesting licence there. That plant alone, if it were to come on line before 2020, would reduce the available biomass within the region by close to half. In the Kamloops region, an- nouncements of new pellet plants that will be supported by a 3 million cubic metre licence were made recently. 2. In this forecast, unharvested AAC con- tributes to biomass. This is essentially CanadianBIOMASS 19 2005 2006 2007 2008 2009 2010 2011 2012 2013 2014 2015 2016 2017 2018 2019 2020 2021 2022 2005 2006 2007 2008 2009 2010 2011 2012 2013 2014 2015 2016 2017 2018 2019 2020 2021 2022 Volume (cubic metres) Volume (cubic metres) Volume (cubic metres) Volume (cubic metres)
Canadian Biomass June 2009: Page 19